
Understanding your target audience is critical to building effective fundraising and marketing campaigns.
But, it’s hard to know where to begin with the research process when building nonprofit personas.
Stakeholder interviews and donor surveys can help a lot in developing your nonprofit’s personas. However, sometimes there are still gaps.
That’s where data from Google Analytics and Facebook play an important role.
In addition to filling in the gaps, data can also confirm findings from other research methods. You may even be surprised by some of the trends and behaviors that pop-up in your data.
If you’re only looking at pageviews, traffic growth, and Facebook Page Likes, you’re missing the full story.
We’ve all been there… looking at Google Analytics and Facebook reports can be overwhelming.
So much data! How do you know what matters?
This guide is here to help you get started sorting through what matters and how to use the data effectively.
By setting up just a few simple reports we can dig deep into data that will help you learn more about your donors, volunteers, members and other target audiences, so that your communications efforts can be more effective.
Use Segments To Compare Behavior and Find Trends
Google Analytics segments are a way to look at discrete user groups based on demographics, type of device, location, behavior and a lot more.
Why is this important?
Take a look at this example of our client’s data.
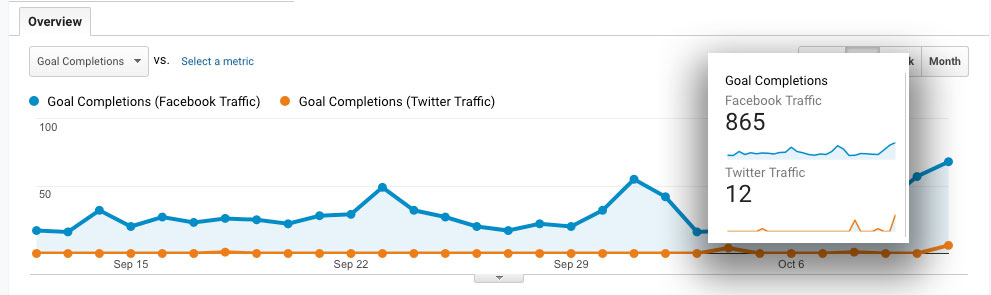
This data shows that over 865 conversions took place on their site from traffic that originated on Facebook.
In comparison, traffic that originated on Twitter converted just 12 times!
Clearly, their ideal audience is spending time on Facebook, not Twitter. This is critical information when making campaign decisions, right?
How do you use segments?
At the top of almost every report, you’ll see an area where you can add segments. Choose the ones you want to compare, then click apply.
Segments may be one of the most important features that you can use when doing research.
It’s important to realize that this process is about looking for trends and anomalies. Not all reports are going to give you a nugget of information. But, keep digging and you can find incredible insights.
Take some time to explore the different segments that are available. You can also make custom segments.
Some other popular segments that Google Analytics provides out of the box are:
Organic Traffic
Paid Traffic
Social Traffic
- Referral Traffic
Convertering Traffic
Non-convertering Traffic
Return Visitors
New Visitors
- By Device
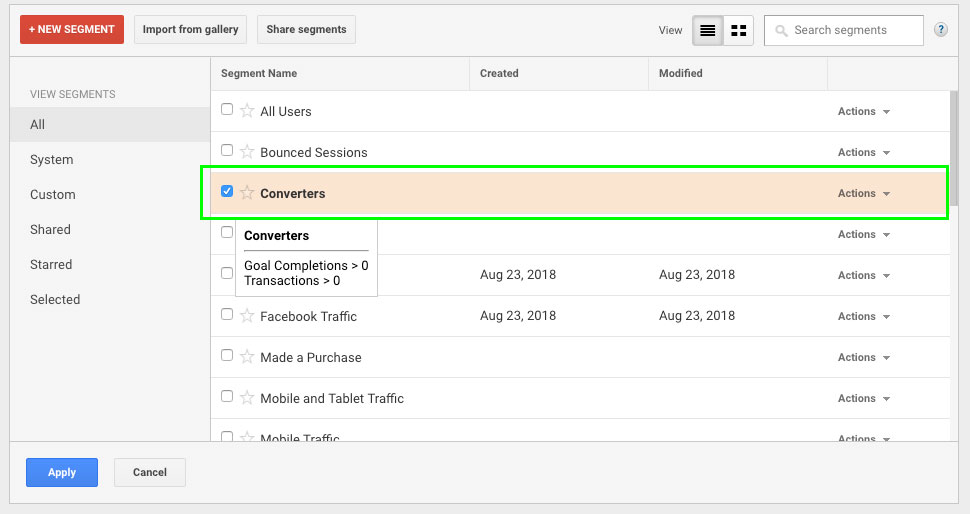
Pro Tip: Segment Traffic By Conversions
When researching your target users, you should be looking for users that have completed a transaction or taken an action on your website to engage with you.
This could be a donation, volunteer sign-up, newsletter sign-up, or any other action you want users to take on your site.
These are the people you want to target, right?
In Google Analytics these are referred to as “conversions.”
If you don’t have conversion goals setup on your website already, do this first. Start by using your nonprofit logic model to decide what actions on your website contribute to your business goals. Then setup a goal and goal value associated with that conversion.
When performing research, we use segment to learn trends and behaviors that are specific to your audience.
After segmenting by converting traffic, think about the following questions:
- What external marketing channels do they come from?
- How often do they come back to the website?
- What pages do they land on?
- What topics are they interested in?
- What actions do they take before they convert?
Hacks to Find Donor and Volunteer Demographics
Now that you understand how to use segments, you can segment to learn a lot about your target audience.
Demographics are critical to getting your messaging and campaigns strategy correctly.
Compare the campaign strategy for communicating with a 60+ year old versus a 30 year old. Different channels. Different messages. Different asks.
Demographic information lays the bedrock for much of what we do in communications.
You may already have a pretty good grasp on your donor and volunteer demographics based on other research that you’ve done. But are you getting the full picture?
How do you know your intuition is accurate?
Use Facebook Audience Insights to Perform Donor Research
Facebook Insights is a little-known tool in Facebook that will provide all kinds of amazing information about people that like your Facebook page or have interests in your mission.
In addition to demographic information like age, marital status, and education, Facebook Audience Insights will tell you about their additional interests so you can start to put together a full picture of your personas.
It can also help you identify potential strategic partnerships.
Go to your Facebook Ads Manager. You can find the Audience Insights in the main menu under Plan.
Once on the page, add your page name into field “People Connected to” field.
This will bring up your audience information. In addition to age, gender, marital status and education level, you can find out location information and additional page likes.
We like to focus on additional Page Likes, as this can tell you a lot of additional information about their interests.
Use Google Analytics Demographics Information
Google Analytics has also developed an interface for analyzing demographic information of users visiting your website.
Some information, like location, has always been available.
However, more recently, Google has given us information on things like age, gender and interests.
Google does not have access to this data on all users, so it is not nearly as accurate as Facebook. Regardless, Google Analytics can be a nice compliment to that information.
Find this information under Audiences -> Overview.
How Should You Use Google Analytics Demographic Data?
Demographics are one of the foundations for understanding your users.
If you don’t understand your nonprofit “customer” (meaning donor, members, clients, etc.) then your marketing campaigns aren’t going to be successful.
Here are a few ways we’ve used this information to develop personas with clients:
Demographic data supplements stakeholder survey and interview information. If you aren’t doing regular surveys or stakeholder interviews, you need to start.
Demographic data will help you create your almighty donor and client personas that underpin your marketing efforts.
Location data focuses your campaign approach. One of the advantages of digital marketing is that you can fish in a targeted area of the ocean, rather than casting a wide net to see where you might find fish.
Location data allows you to identify new locations where you might expand your marketing efforts and find new constituents. It also allows you to see how campaigns in particular locations might be lifting your overall performance (think radio PSA, billboard, newspaper ad or article).
Don’t forget that all of this is in context of your work.
Perhaps you’re wondering if your target audience is urban or rural.
Perhaps you’re interested in knowing what regions you need to target for an acquisition campaign.
What are some creative ways you can use this data in your marketing efforts?
Using Event Tracking To Understand Behavior
Google Analytics events are ways to track behavior on your site that may not be business critical, but do show user engagement or behavior trends.
In particular, it can help you understand how users are engaging with content topics and how users are using your user interface.
Here are some common events that we setup on client sites:
Page Scroll Tracking. Using a tool like Google Tag Manager you can setup events to fire based on how far down the page users scroll.
This can help you learn more about how users are navigating your landing page, or you can use this to find out which blog posts are getting the most engagement. This could help you adjust content strategy and the topics of your content.
Video Watching. Events can also be fired when users what a video. This would give you insights into which videos are most popular, and the topics that resonate most with your users.
Track UI calls to action. For example, let’s say that you have a banner image on your homepage with a button that has a main call to action.
You can track the number of times that users click on that button versus using the main navigation to get to a location on your site. You could do the same thing for sidebar call to action buttons, etc. Again, these are not main conversions, but it would inform you how users are navigating your site.
Using Traffic Channel Analysis to Research Your Target Audience
How is traffic coming to your website? More importantly, which traffic is most engaged and converting on your website?
You can see an overview of traffic by channel under Acquisition -> Overview in Google Analytics.
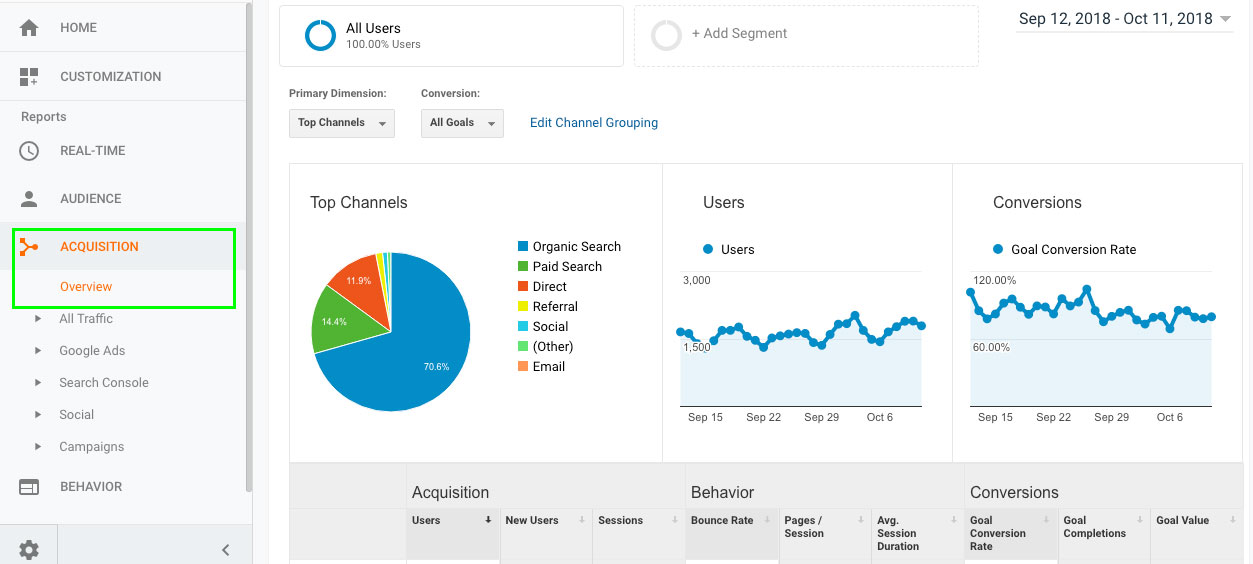
Use Traffic Channel Segments to Dig Deeper
Instead of using the overview report, I prefer to use segments and compare behaviors.
Some questions that are helpful to ask yourself:
Which channels drive the most conversions?
Which channels drive the most engagement with content?
Does a particular channel drive most of the conversions for one goal? Meaning do volunteer sign-ups come from Twitter, but donations come from Facebook? If so, this can lead to two distinct personas.
Are there clear demographic patterns based on channel?
Use Organic Search and CPC Campaigns to Learn More
When you connect Search Console and your Google Grants account, Google Analytics will provide really powerful information about what users were searching before they landed on your site.
Why does this matter?
Search queries can provide a really clear view into a user’s motivations and concerns.
If you can connect traffic to search queries and behaviors, then this can help you model your target audience’s motivations and concerns.
If you have connected these services to your Google Analytics account, go to Acquisition -> Search Console -> Queries to see organic search queries.
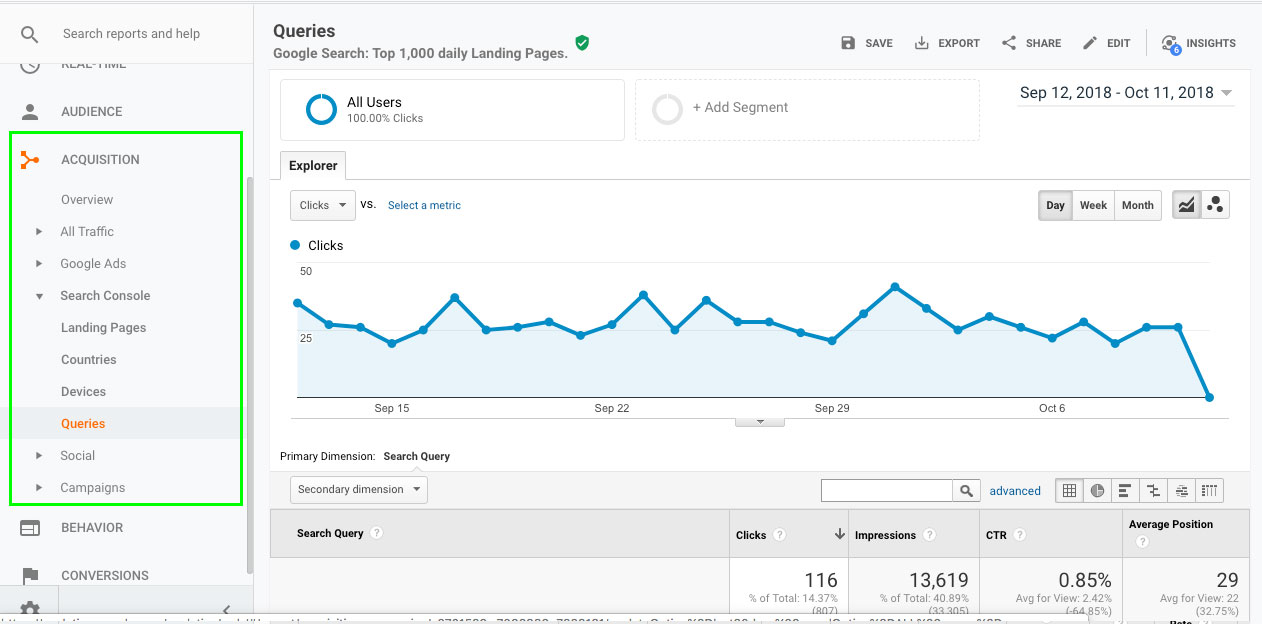
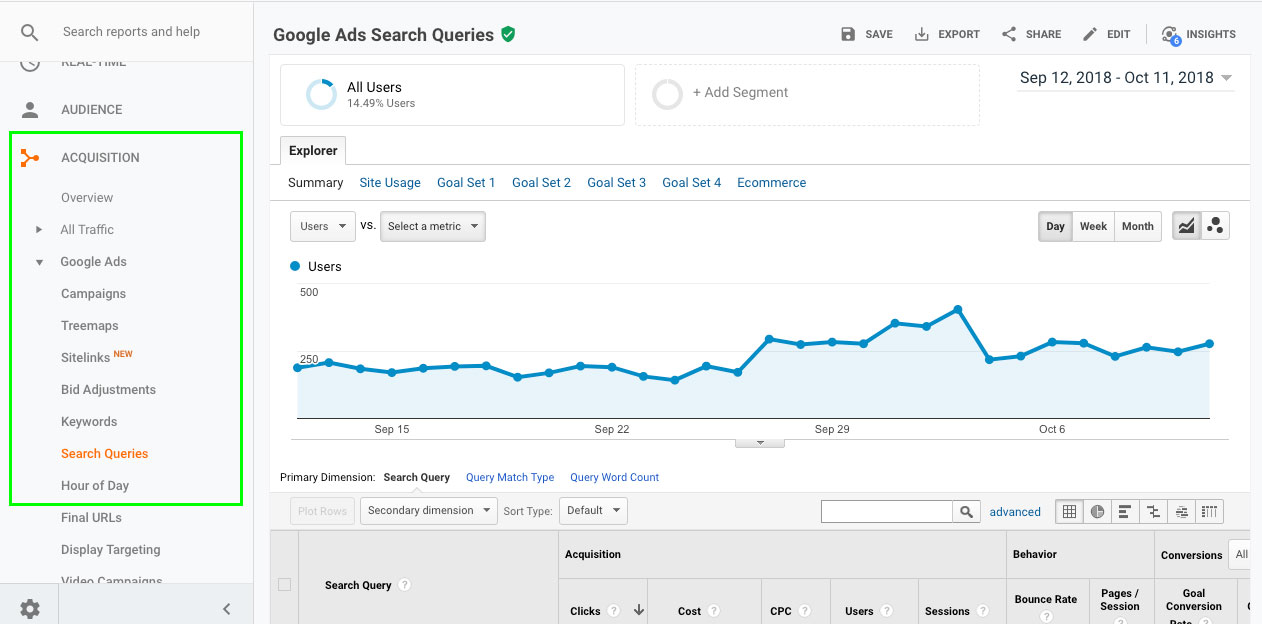
You can see your Google Grants data by going to Acquisitions -> Google Ads -> Search Queries
You’ve Done Your Research. Take the Next Step…
If you have completed surveys, stakeholder interviews and done your data research, don’t let implementation paralysis stop your next steps…
You’re now ready to build your persona!
Here are some tips to creating your personas:
Create your personas with a group of colleagues. Each individual in your organization has a unique experience with your personas, therefore a unique perspective. Bring those experiences together to build a 360 degree view of who your persona is.
Spend a minimum of 20-30 minutes per persona. It’s worth taking time to get the details right. Don’t assume anything, and make sure your assumptions are backed up by data and survey results.
Think outside the box. Don’t just hone in on donors. Think about strategic partners, press, clients, board members and others.