
“I’m a real data person.”
I hear this all the time from our nonprofit clients. And, honestly, we love data too!
The real question: “How is your team making marketing and fundraising decisions based data you collect?” Furthermore, are those data-based decisions positively impacting your key business goals? How do you know?
Or, like 58% of Executives (according a survey by PwC research), are we making decisions based on our previous experiences and “gut” feelings.
What does it take to really make to be a data-driven marketing team?
In this post, I want to provide a starting point for any organization that is looking to do a better job making data-driven marketing and fundraising decisions.
We will provide tips on how to better collect your data from your website, email marketing and social media marketing channels. Finally, we will look at how to make it digestible and actionable.
Setup Google Analytics Conversions
At Rootid, we get asked a lot: “what metrics in Google Analytics is most important to track?”
The answer is… It depends.
I know, that is not the answer you were looking for. But, it’s true.
Every organization has different inputs, outputs and outcomes they’re looking for. If you haven’t defined this at your organization, it’s worth doing a logic model exercise. It will clarify your marketing and fundraising a lot!
If you do have a firm grasp of your business logic model, then the most important data to track are your KPI (Key Performance Indicators). Or, simply put, the actions that you want users to take.
Some examples of KPI’s:
- Online Donations
- Newsletter sign-ups
- Membership sign-ups
- Applications submissions
- Contact form submissions
- Etc.
When you are thinking through your communications strategy, think who are your audiences, and what do I want them to do.
If you don’t know your audiences, try using surveying and stakeholder interviews to learn more about their motivations, interests and how to message to them.
So, why do you want to track KPI’s?
First, these are actions on the site that provide value to your organization (more to come on this). They are actually transactions with some monetary value, or they may provide engagement value now that leads to monetary value later.
Meaning, they indicate a how users are engaging with your organization.
Secondly, goals should be the main data point that drives your marketing strategy decisions. Goals allow you to filter the mountains of data that Google Analytics provides in order to show you information about those users that are performing the actions that provide value.
Interestingly, you can also look at the behaviors of user that do NOT convert, and try and figure out how to better make them convert.
Finding trends in this data can help you make larger decisions about how to improve your website, messaging, campaigns and much more.
You can find out things like, where users originated from, what channels are most effective in producing goals completions, etc.
Assign Value for Your Google Analytics Goals
When you are setting up your Google Analytics Goals, it’s really important to add a value in your Goal Details when setting up your goals.

Many of our clients say, “well there is no monetary value to our volunteers. Volunteers are not paid.”
True. Kind of….
It is correct that no money it exchanged, but every transaction has a value to your organization. Here are some ways to think about a few common transactions:
Volunteers: If your average volunteer shift is 4 hours, and they perform a service or task that a paid employee would have to do if the volunteer was not there, that’s value. You could say then that the task volunteers perform is worth $10/hr (I made up this value, feel free to assign your own). Therefore, each volunteer sign-up is worth $40.
Newsletter Sign-ups: If on average you generate $20 per email that is on your newsletter list each year (Formula: Total Donation Amount from Newsletter List / Number of Emails on Your List = Average Value per Email), then you can easily say that each email sign-up is worth $X per year to your organization.
Membership Applications: if your membership dues are $50 per year, then each membership sign-up is worth $50.
There are a few reasons why using values matters:
First, goal values will help your team make strategic decisions about where to invest staff time and resources. Which efforts are truly generating the most value for your organization.
Second, you can also use this data to figure out which marketing channels are producing the most value to your organization. We will talk more about this in the UTM tags section below.
Finally, if your organization is doing any paid advertising, you can use these values to understand ROI (return on investment) and ROAS (return on ad spend).
Setup Google eCommerce Settings
There are some transactions that have immediate value.
For most organizations, generating revenue through donations, memberships, tuition or some other means is a critical part of their business model.
Google eCommerce settings was built for online retailers, but it is a critical piece of data for nonprofits as well.
In a nutshell, eCommerce settings will track the amount of money that spent on your website on a transaction by transaction basis.
You might be saying, “that seems like an issue with donor privacy!”
The good news: Google is just tracking the amount and product of each transaction. There is no personal information that gets logged with the transaction data.
For nonprofits, it will provide you powerful insights into which marketing activities are generating the most money online.
If you use a 3rd party system (like Classy, Action Network, etc.) to process your online payments, there may be a chance that it provides a simple plugin that dynamically sends this transaction data directly to your Google Analytics account.
If your online payment processor does not provide feature, then you will likely need to work with a developer to get this setup correctly on your site. The implementation often requires some custom javascript code on your donation page.
That said, it is worth investing a little bit of money in your analytics to get a TON of powerful data.
Google Analytics Goal Wrap-Up
Don’t forget, goals are essential to making informed data-driven decisions about how much value is being generated for your organization, and what channels are driving that.
Once you have your Google Analytics Goals setup, do this…
How to Use Google UTM Tags
Wouldn’t it be great if you could have a granular understanding of which campaigns, marketing channels or even individual marketing pieces (think blog posts, emails, social posts) are driving them most value for your organization?
What if we could even drill all the way down to which specific link within an email campaign is working best?
You can with Google Analytics UTM (Urchin Tracking Module) tagging!
UTM tags are built into Google Analytics, and there’s no setup required.
By simply adding some data to the end of a link, you can send a bunch of data to your Google Analytics account each time a user clicks on that link.
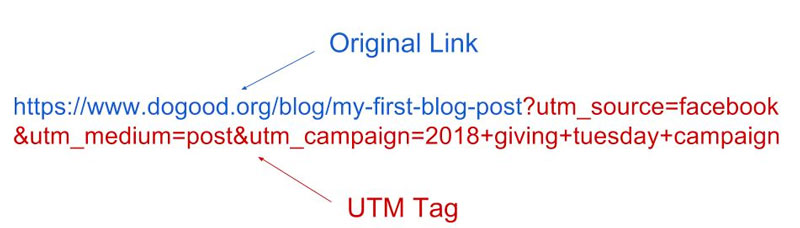
Anatomy of a Link with UTM Tags
So, what are UTM tags?
You likely have seen them before. Maybe without knowing it.
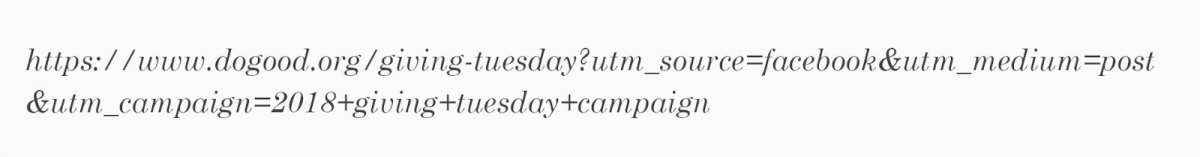
Below is a breakdown of what a link looks like that includes UTM tags.
How to Use UTM Tags in Your Marketing Efforts
The beauty of UTM tags is that they create “layers” of data that allow you to drill down in order to find where you are generating the most value for your organization.
Here are the 5 values that you have access to, and how we recommend your organization uses them:
Campaign Source – this should be the platform (or vendor) where the traffic originates, like Facebook, Twitter or your email newsletter.
Campaign Medium – Identify the medium like Cost Per Click (CPC), social media, social ad, blog post.
Campaign Name – Identify the specific campaign that the content is a part of. For instance, “2018 Year End Donor Appeal”
Campaign Content – If you’re A/B testing ads, then this is a useful metric that passes details about your ad. You can also use it to differentiate links that point to the same URL. For instance, if you have a banner at the top of an email and a button at the bottom of the email, this can be used to tell you which link the user is clicking more frequently.
Campaign Term – In most cases, you will not need to use this. This is mainly used for tracking your keywords during a paid AdWords campaign. If you’re not using paid CPC advertising.
Note that these are only suggested uses. Each organization is going to find a system that works best for them. So, it is important for your team to talk through it and setup rules together.
Tools That Help Build and Manage Your UTM Tags
So, what’s the best way to build these links?
Fortunately, there are a few killer tools that can help.
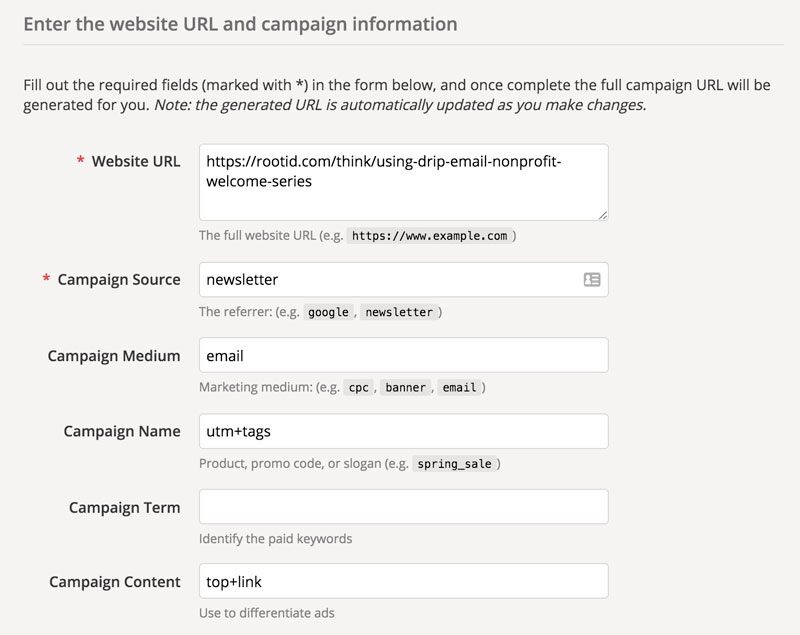
Google URL builder is really easy to use. Just fill in the appropriate fields, and Google will spit out the full link at the bottom. It also will shorten the link for you so you use them in your posts without seeing the ugly tags.
Conveniently, Google usually will save the last link that you entered into their tool.
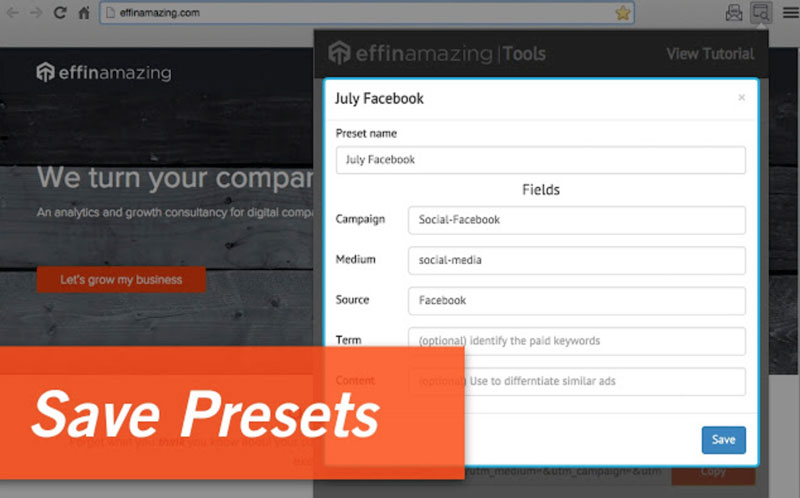
You can also use the Effin amazing UTM Builder Chrome extension to create UTM tagged links. It auto-populates the URL and saves your most recently used values as presets.
It also has a built in bit.ly URL shortener that is a nice add-on. Plus, it’s right in your browser, so you don’t have to bother with going to a new web page to use it.
Using a custom spreadsheet to generate UTM tags
Using this awesome free Google Doc from Rafflecopter to generate UTM tags is our favorite way to manage UTM tags.

First, it will help you manage your links when you have a team of marketers linking to your website across the web. This tool will help ensure that your team is using a consistent naming convention.
Second, it helps you avoid spelling mistakes, which can really screw up your data in Google Analytics. Typos can make data analysis harder (more about this in the Common Mistakes section below).
Last, if you are like most nonprofit marketing teams, you may have several different campaigns going on at the same time. By using this spreadsheet, you will be able to refer back to a list of campaigns that you may have at any given time. Keeping track of the campaigns will help you remember which campaign is which.
UTM Tag Best Practices
1. Create a naming convention for your UTMs.
You are probably not the only one on your team building links, so make sure there are guidelines about the structure of your tags.
Pro Tip: Using “+” symbol will add a space to your data, which makes them easier to read in Google Analytics. We generally recommend not using “-” or “_” in the names if you can avoid it.
2. Always use lowercase with your tags.
For example, utm_source=eMail is different from utm_source=email.
Or, utm_source=LinkedIn is different from utm_source=linkedin.
Why does this matter?
Google Analytics will respect the capitalization in your data. So, when you use capitals sometimes and not others, your data that was meant to represent one utm_source will actually be on two different lines.
This will make your data harder to analyze.
3. Keep your URLs clean, descriptive, non-redundant and easy to read.
Avoid using the same word or vendor name in two different tags. This is redundant and will make your data confusing.
So, do not do this:

Try to make your data flow like you would read a sentence.
For example, “the user came to our website from facebook, by clicking on my post from our 2018 giving tuesday campaign.”
Do this:
4. Create a system that works for your organization
Ultimately, there is no right system for every organization. You will need to work with your team to generate a system that works for everyone.
Write it down, and stick to it!
Common Mistakes to Avoid
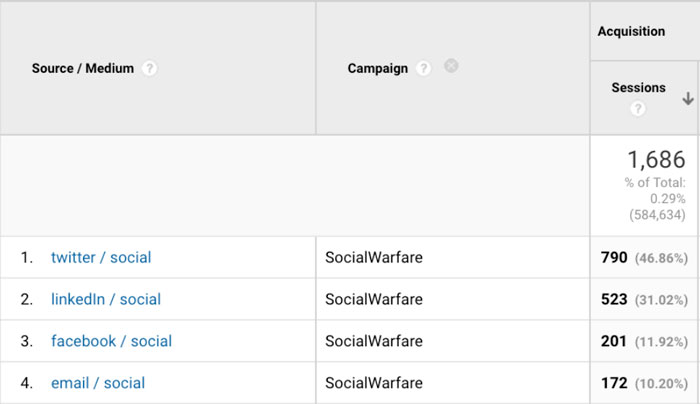
Creating unique campaign names for each medium and source
You want your UTM links to span multiple marketing channels. That’s one of the purposes of UTM – track how each channel contributes to a specific overarching campaign.
If you tag your links correctly, here’s how your data should look.
2. Making spelling mistakes when using Google Analytics UTM tags
If you have multiple administrators creating tags, or you are building many tags each day, it’s really easy to make spelling mistakes using something like the Google URL builder.
Especially when you have longer campaign names, it can become very easy to mistype something.
We recommend using the free Rafflecopter Google Doc to build your links. That way, you are consistent with your campaign naming.
This will guarantee that your Google Analytics data remains clean and useful.
3. Using UTM tags to track internal links – Don’t do it!
Unfortunately, sometimes we see clients add tags to their main menu, or buttons on their homepage.
They set values like utm_medium=mydomain.com and utm_source=homepage+banner.
The bad news is that if a user clicks on a link on your Twitter account that has UTM tags, then clicks on the button on your homepage that have different UTM tags, the original Twitter UTM tags get overwritten.
In your Google Analytics report, your Twitter post would no longer get credit for the user’s actions. Instead, you would simply see that the user came from your homepage banner.
The original referrer will be overwritten and your data will be messed up.
You should never use campaign tagging for internal links.
If you want to track how users are interacting with your website, use a tool like HotJar, or another heatmap service.
UTM Tag Wrap-Up
Once your UTM tagging is in place, it provides you a 360 view of how your marketing channels are contributing to website conversions. On almost all of the reports within Google Analytics, you can filter you view to show any of the UTM data layers (campaign, medium, source) to parse your data.
By using these data layers, your team should be able to better understand which marketing efforts were most successful, find trends and then use that data to continuously improve your campaigns.
Building Meaningful Data Reports with Google Data Studios
By this point, the important tracking pieces are in place. Now, we need to make sense of the data we are collecting.
Making your data digestible is critical to making data-driven decisions.
We have seen a lot of different ways to manage data reporting from our clients.
- Google Analytics custom dashboards
- Excel Spreadsheets
- Custom Data displays in 3rd party services
However, none of these other options include the flexibility, professional visuals and dynamic nature of Google Data Studio.
Get started with your reporting using our Nonprofit Google Data Studio template.
Download Our Dashboard Template
Once you’ve downloaded the template, follow these instructions to get your custom dashboard setup.
Connecting Data Sources
First, Google Data Studio allows you to connect data from multiple data sources. It takes less than a minute to connect each source. Some of our favorite connectors include:
- Google Analytics
- Google AdWords
- Facebook Ads
- Google +
- MailChimp
- Stripe Payment Processing
Each connector has a setup of metrics that you can add to your reports and display in a professionally designed way.
Professionalize Your Data Visuals
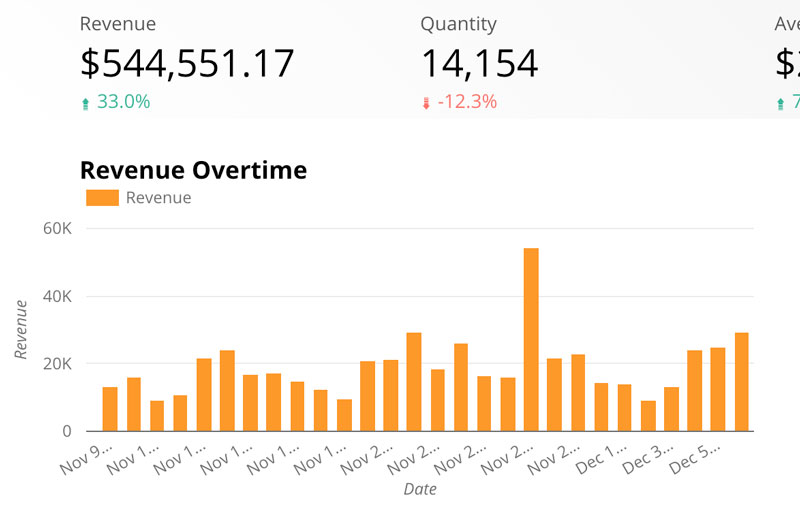
Second, Google Data Studio provides a beautiful visual design suite that allows you to make your data really stand out.
It’s really easy.
The drag and drop interface allows you to select from a number of different types of data displays like bar graphs, line graphs, data tables, pie charts, to name a few.
You can also add design elements like colored backgrounds, custom graphics and dynamic link text if you want to refer to outside resources.
Settings up the reports to use your brand colors, fonts and logo is really easy.
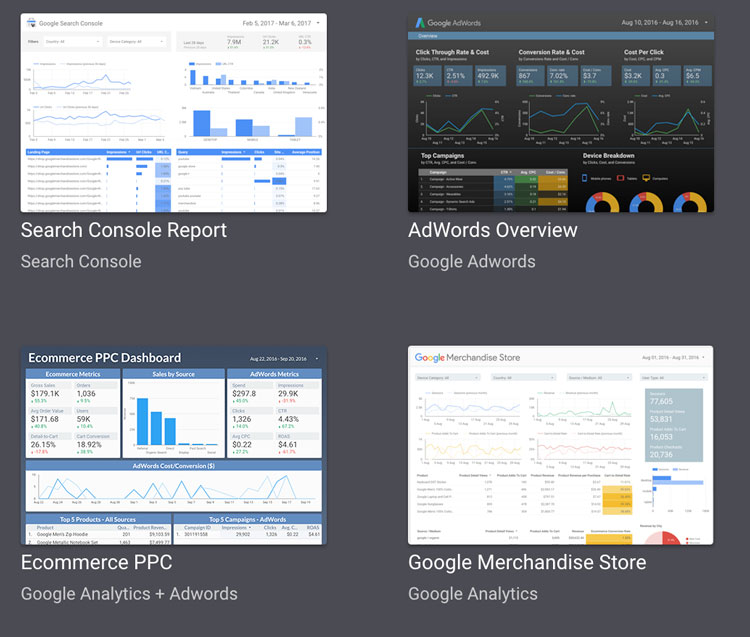
If you don’t want to start from scratch, Google provides wide variety of starter templates that are easy to customize to your liking both visually and with your data.
Sharing Your Data Reports
Last, sharing beautiful reports is extremely easy with your team, colleagues and board.
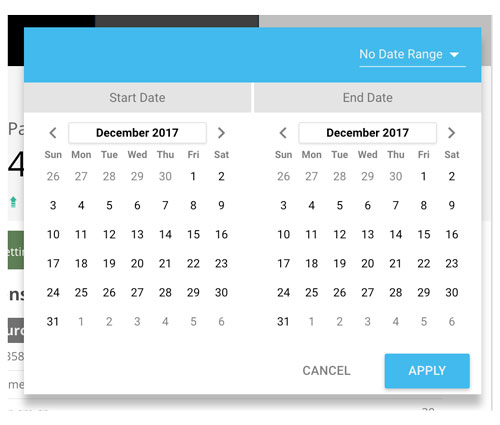
One of the other great features, is that the data is dynamic. Users that are viewing the report can change date ranges, filter by data sources and much more. It makes the data a much more interactive experience.
Not only does this make the data more interesting, but there is definitely a sense of professionalism and intrigue around the reports.
Just think, you will never have your monthly analytics report thrown in the trash again!
Conclusion
Now your ready to be a data-driven marketer. That’s a powerful feeling!
To recap, remember that data will empower your team to be better decisions, but it needs to be measured in a smart way. These techniques are a starting point that will help you make better decisions in your marketing strategies.