
"*" indicates required fields
Few great things in the world were created without first planning, then measuring. So, why is your nonprofit any different?
All too often, it’s hard to know what should be measured and what should not be. What is really important for your nonprofit to measure?
Tools like Google Analytics and other data sources have so many reports and data fields. How do we know what’s meaningful?
The good news is that if you are reading this article, you’re headed in the right direction – you see measurement and data as a valuable tool to make informed decisions and tell your impact story.
This post will walk you through the process of building a measurement plan that’s specific to your nonprofit. It will help you choose the data and reporting that’s important to monitor so you can become a more data-driven nonprofit.
Ignore the Headlines – Kind Of
Many nonprofits get caught up in metrics that aren’t as important as they think. Especially when it comes to their website.
Too often we’ve had clients only monitor the number of page visits and bounce rate of their site to measure success.
These metrics can be important, but only in context of your broader goals.
If you goal is to raise $100,000 through your website, wouldn’t you want to track the money coming in instead of the page visits?
Of course you would!
The same is true if your nonprofit goal is to recruit more volunteers, members or acquire more donors.
I often think that organizations fall in love with these headline metrics because they’re not sure what else to measure. And, they like the big numbers!
Luckily, we’re here to help your team get out of that habit.
Establish Your Nonprofit Outcomes and Work Backwards
The best way to establish a good measurement plan is to start at the end result and work backwards.
Using a nonprofit logic model can be a powerful tool to provide structure to your business goals and define your measurement needs.
To summarize how this works, let’s look at an example from the logic model post that we linked to above.
EXAMPLE ORGANIZATION (We made this up): Clean-up And Restoration Team (CART) is a volunteer-driven environmental clean-up and restoration organization that uses volunteer labor to clean-up locations that have been left polluted by industrial companies. With volunteer crews they clean-up these locations and restore them using native species of plants.
CART has two identified outcomes:
- Restored Native Habitat & Clean Drinking Water
- Empower and Educate Local Community Members
In order to achieve these outcomes, CART needs to generate certain business outputs. (Read more detail on how to differentiate outputs and outcomes in the logic model posts)
CART’s identified outputs are:
- Educated and Empowered Community Volunteers
- Acquired Land to Clean-up
- Volunteer Crew Leaders
- Native Plants
You can see how the outcomes and outputs relate below.
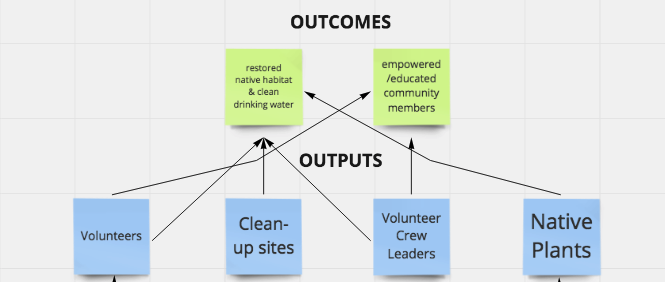
Outputs are what we want to measure. Outputs represent the things that your business needs to generate on your website and other marketing channels to generate the outcomes you want to create.
Write down the outputs you need. These are going to be one set of KPI’s that we want to record.
But, wait!
Don’t forget that outcomes should be measured as well. These often tell the best story.
For CART, they could measure the number of acres of restored Habitat. They could also measure the the miles of streams that have been affected by the land clean-up. Sometimes these larger numbers can be more difficult to come by, so make sure that you’re recording these project successes somewhere. They tell a great story!
The measurement doesn’t stop here though….
Define & Measure Key Performance Indicators (KPI’s)
With any business goal, there will be actions that individuals take that relate to your activities and key outputs, and there will be actions that people take that represent a step towards that ultimate outcome.
For instance, with CART one of their key activities is recruiting volunteers.
However, they also know from analyzing their data, that one out of five individuals that signs-up for their enewsletter on their website will eventually become a volunteer.
So, you could see why they want to measure both, right?
These are referred to macro-conversions and micro-conversions.
Macro-conversions have direct impact on your business goals. Micro-conversions may lead to an eventual macro-conversion.
To follow along with our example, CART has 3 macro conversions:
- Volunteer Sign-ups
- Clean-up sites Available
- Active Volunteer Leaders
Here are some potential micro-conversions:
- Volunteer Orientation Attendees
- Newsletter Sign-ups
- Volunteer Leader Application Submissions
- Interested Clean-up Location Form Submissions
You can see how these micro-conversions are indicators of opportunities that could turn into macro-conversions. But, these two are necessarily not directly related.
Tips to Measure More Effectively in Google Analytics
Once you have established your micro- and macro-conversions, it’s time to create the conversion goals in Google Analytics.
If you haven’t already, setting up Google Analytics goals in your account is a must. Remember at the beginning when we said that we should ignore the headline metrics? That’s because goals are the bread and butter of your organization’s success. So, we need to set them up.
Here are a few tips for better measurement:
1. Assign a Value to Macro-Conversions: Even if you don’t think your conversion has an explicit dollar value, it’s important to think hard about this.
In the case of CART, you may assume that volunteers have no value. They do!
How many hours is a volunteer shift? Multiply that by the amount you might pay a laborer to do that work. That’s the value of a volunteer sign-up.
Value of Volunteer = Length of Shift x Assumed Wage
Once you start to see this value, you will start to understand that your marketing efforts are generating value for the company.
And, if you are advertising, you’ll be able to establish return on investment (ROI) on your ad spend.
2. Use Campaign Tracking in Your External Marketing Channels: Google has a nifty feature called campaign tracking, or UTM tags. This allows you to add pieces of data into links that you use in social media, emails, or anywhere that give rich insight into where your conversions are coming from.
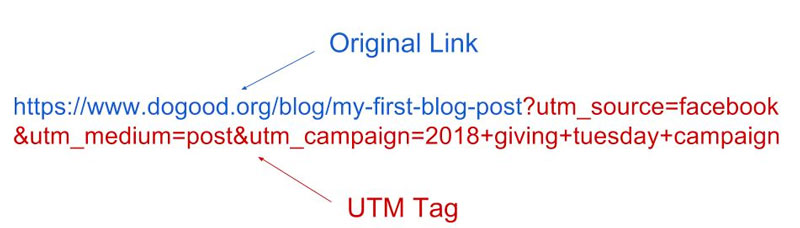
Why does this matter?
By parsing out your marketing efforts, you will have real visibility into which marketing channel and effort is helping you generate the outputs your company needs.
This allows you to focus your efforts and prioritize your work.
There are lots of tools and best practices that will help you implement this at your organization to become a more data-driven nonprofit.
Why is Data Important for Marketing and Communications?
Too often we think of data as being internal facing. It helps us make decisions about the effectiveness of our programs. It influences budgeting and business decisions.
The truth is that data is also critical to your outward facing communications, and telling your impact story.
All nonprofits have a vision for how they will affect the world. That vision is what will initially attract your supporters – it’s the “why” that gets them hooked on your mission. But, showing impact is what will keep funders and supporters coming back time after time.
It’s great to have an inspirational story, but if you want to scale your impact, you need to show funders and supporters that you’re work is making a difference at a larger level. Data tells that story.
Consider the difference between these two impact statements:
In 2018, CART empowered community volunteers to restore abandoned industrial waste sites and helped restore the quality of our drinking water.
This is fine, but relies on the anecdotal. Were there just 10 volunteers? Did they only do one project? If so, that’s not really that impressive. There’s no expression of real impact here.
Compare that to:
In 2018, CART empowered 20,000 community volunteers to restore more than 1,200 square miles of abandoned industrial waste sites (that’s the size of Rhode Island!) and helped restore the quality of our drinking water to over a million people!
Wow! Now that’s scale….
Not only does measurement tell the impact story better, it also shows funders and supporters that your organization is sophisticated enough to be able to measure. It shows them that you’re taking a methodical and calculated approach to your mission.
If you can then back-up this measurement with a great story, then you have a winning communications formula.
Develop a Nonprofit Culture of Data
Now that you understand the process of turning business goals into measurable outputs. How do we make this matter on a day-to-day basis?
This is a tough question. Establishing a culture of data is not something that happens overnight. There are key elements to help your organization make this transition.
Everyone Onboard
The role of data should be recognized at every level of your organization. And, the access to data needs to be democratized.
If you have a data analyst at your organization, then you can’t expect them to be the gatekeeper to all data.
Leaders, directors, managers and interns all need to be able to make decisions around data.
Once everyone is onboard, carve out time at your department and staff meetings to talk about what you’re seeing in your data.
Decision Making Process
When everyone has access to the data, decision making processes should follow similar models to what we’ve talked about above.
What are the outcomes we want? What are the outputs needed for that? What are the inputs needed to get there? How do we expect that to show in the data we currently have?
By starting with an outcome and then building a strategy, you can track your efforts more closely.
Don’t be afraid to fail! Rather than putting your head in the sand if the data shows that your efforts didn’t pan out, use the data to figure out why it didn’t turn out.
Refine your approach and try again.
Madness is doing the same thing over and over again expecting a different result. Data helps us do things differently.
Build Tools That Provide Access to Data
In order to put the power of data in everyone’s hands, it’s important to build tools that they can use on their own.
Luckily, Google Analytics allows you to build dashboards that anyone on your team can access. It also allows you to automatically email these on a regular basis to the whole team. This gives everyone direct access to the latest information.
The second option is using Google Data Studio.
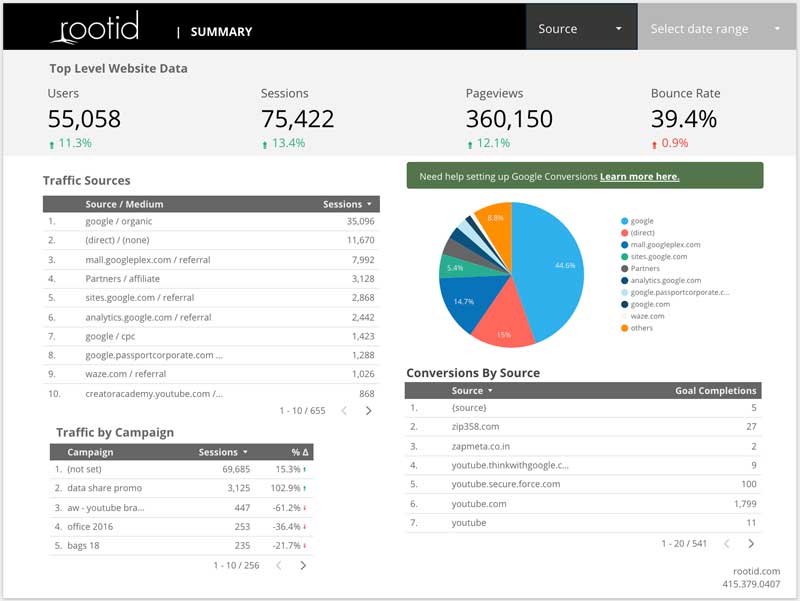
In addition to pulling in GA data, Google Data Studio will allow you to pull in data from a number of different services like email services providers and social media platforms. It can serve as your central data dashboard.
Check out Rootid’s nonprofit Google Data Studio dashboard template that you can use to get started.
Wrapping up
I get it. There are million things going on at your organization, and this may not be top of your list.
However, it’s important to take the first step in this process. Bring it up at your next meeting, or frame your next conversation with your team based on data that you see taking place on the website.
Framing your conversation in this way may spark a larger conversation around our biases to make decisions based on gut and not proof. That can be a powerful place to start.