Infographics are come in many different shapes, sizes, formats and quality. I am sharing the process in developing this particular infographic because my learning process was particularly interesting this go.
Our goal was to use as much of the branding from the Ignite online exhibition (a project of the Global Fund for Women), but make sure it felt like a stand alone piece as well. In my intial research, I found quite a few infographics that already used some of the statistics we wanted to put forth, but we wanted to tell the story from a place of empowerment and hope, rather than bitterness or negativity. Sometimes, this is a little hard when you are talking about gender inequalities…
In any case, let me share our process with you.
STEP 1: Figure out what the top 3 goals are.
In our case, as I said, it was to set a tone of empowerment and hope. It was to display important points in a visually appealing way that still expressed the weight and inequality of the information. And most of all… to tell a strong story—to guide our viewers from a place of superficial impressions to one of, “Wow! Can that be true? How can I help make this better?”
STEP 2: Nail down what statistics you want to use to tell your story.
It is important to drill down as fast as possible from “concepts & feelings” to “specifics & numbers.” If it is still taking a paragraph to say what you want the reader to understand, then brainstorm a different way to get across your point. Or maybe, that point needs to be replaced with another. Even though you need to nail down your stats quickly, it is also important to always use your original goals as a touchpoint. Check back that you are not getting lost in the numbers and loosing the story.
STEP 3: Make a sketch or wireframe of how you want the information to be laid out on the page.
Your first wireframe should be as loose and general as possible. In our case, we broke the infographic into 7 main sections.
1. Header/Banner with Title
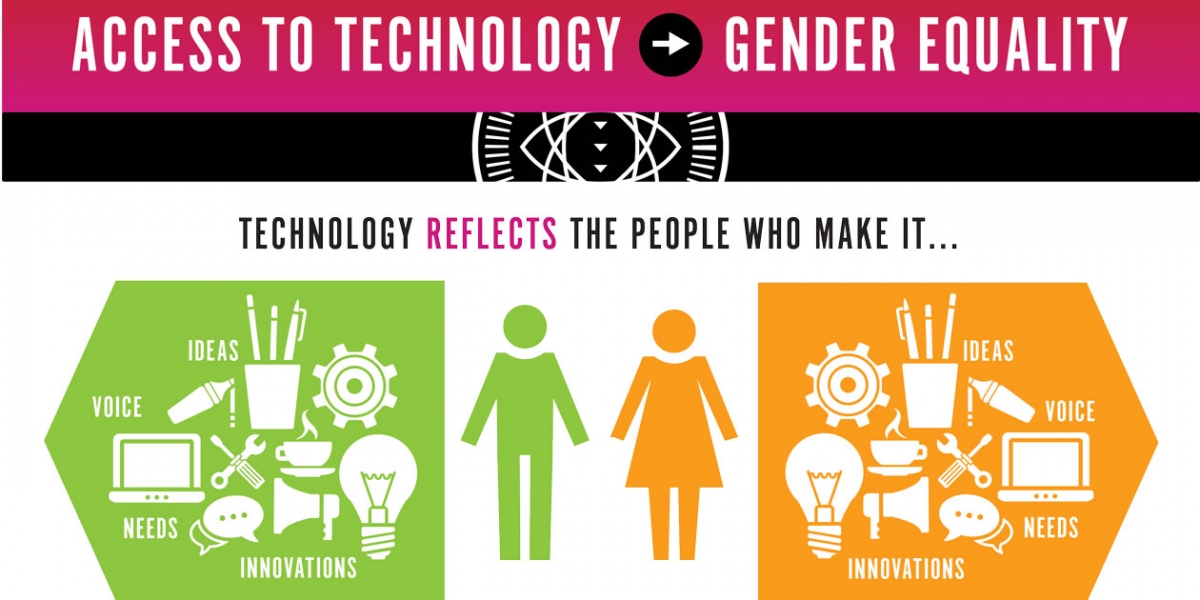
2. The Introductory Idea/Thesis/Hypothesis…however you choose to label this [technology reflects the people who make it]
3. & 4. The 2 points That Support Our Claim [less access to technology/ideas but not opportunities]
5. The Conclusion [inclusive teams are smarter, faster, etc.]
6. A Quote and Closing Statement
7. Footer with Branding and Get-Involved Info
[For more information about wireframes, read How to Make a Good Wireframe.]
STEP 4:
Now it is time to begin design. In this case, we already had branding to work with so we could skip moodboards and visual identity creation and instead focus only on how to illustrate the important bits of information in a way that would flow visually and emotionally. We did not want to weigh the infographic down with too many images, but also did not want to make it too text driven either. It is important to create a clear visual heirarchy that smoothly guides the reader, providing strong “ah ha” moments as well as moments of rest and reflection before moving onto the next data point. Color use was an important consideration since pink and blue are a bit over used when illustrating points of male vs. female—we wanted to come up with options that would feel more gender neutral while still communicating gender inequalities clearly.
Check out the final product. We are pretty happy with the results!